
Besides
pigeons, sewing and bits and bobs of D.I.Y. I am really ever-so fond of mathematical conundra.
I enjoy messing about with spreadsheets, devising nit-picky formulae, and then using AutoCAD to illustrate the results because I am not whizzy enough with spreadsheets to get them to draw graphs for me. And anyway, it's far more satisfying to draw them myself.
Last week, purely for my own entertainment, I calculated an imaginary compound interest rate to illustrate the increase in value of my London property over the 34 years I have owned it. Then I downloaded the UK Land Registry data for average London house prices over the same period and compared the two. My curve is far more beautiful but theirs is closer to what actually happened.
By this weekend I had run out of numbers to play with and so sat down to read some more of Yanis Varoufakis' political memoir, and lo! He had included a graph illustrating the appalling decline in Greece's national income between 2007 and 2014. Oddly it goes in the opposite direction to last week's graphs.
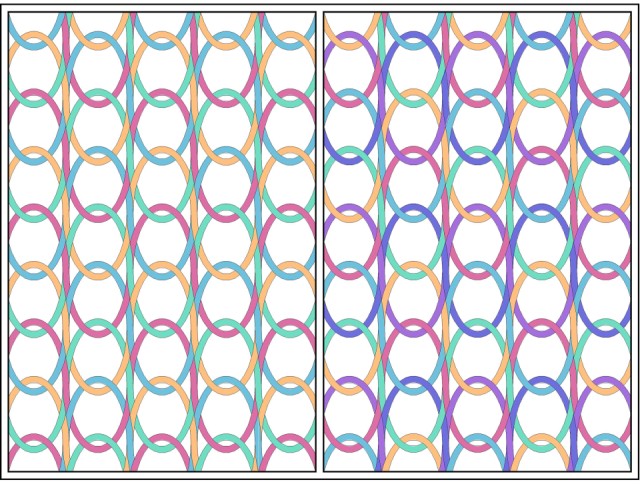
And then I just started mucking about with ellipses and colours. I can get away with a minimum of four colours but I prefer six.
Comments
Sign in or get an account to comment.


