
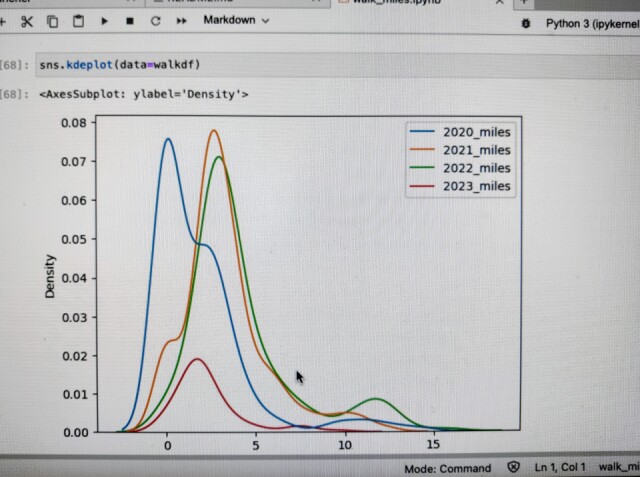
KDE plot
For the last few years I've recorded how far I walk each day. And then I've been plotting the data using Jupyter Notebooks in Python.
A kernel density estimate (KDE) plot is a method for visualizing the distribution of observations in a dataset. It's like a smoothed out histogram.
Comments
Sign in or get an account to comment.


