
G Type Main Sequence Star
When the temperature of a star is plotted against its luminosity the resultant graph has the majority of stars grouped on an area known as the Main Sequence. This is where they spend most of their lives, burning hydrogen in their cores. The graph is known as the H-R or Hertzsprung-Russell Diagram, after the two scientists who independently determined the relationship between a star's absolute magnitude and surface temperature in 1913.
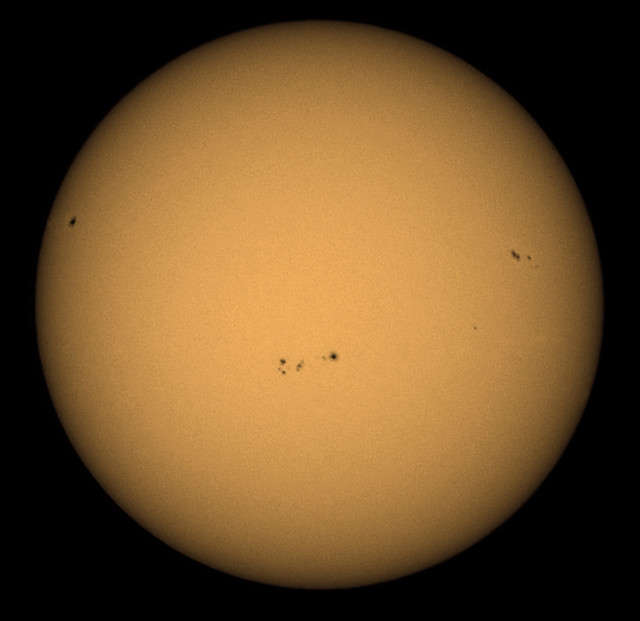
The Sun is classified as a G type yellow main sequence star, although G types are usually white or yellowish white, having a surface temperature of about 5,700k.
Of interest in the photograph is AR 2005, just appearing at upper right. The core of sunspots are depressed below the surrounding surface and because of the perspective effect at the limb this depression can be seen. It is known as the Wilson Effect. AR2005 currently demonstrates this if you look carefully.
183
views
- 5
- 0
Comments
Sign in or get an account to comment.


