
Storyteller Series - #27 Neighborhood Census Data
... continuing on with our virtual tour....
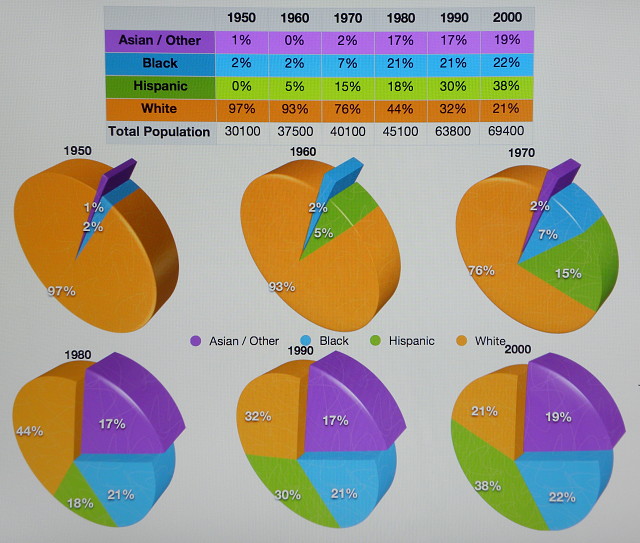
I have been learning how to do spreadsheets and make charts with my iMac. This is some of my handiwork. I opted to use the "fun" color palette in keeping with the colorful tiles of the Storyteller, hence the-in-your-face brightness.
I don't think I have to decipher the data as the pie charts show it very nicely. We are in the process of mailing our 2010 census data in to the government, so I am not sure when the newest data will be available and how I can get that information, but I will try to do that when the opportunity arises.
The designing artist featured in this blip series is Sayoko Kay Mura
Comments
Sign in or get an account to comment.


